
PR professionals often pride themselves on being storytellers, able to frame a company’s narrative in a way that captures attention. But here’s the thing: finding an angle is only one part of the equation. The other is evidence. Without data to back up its claims, a story won’t go far, especially with increasingly skeptical audiences inundated with content every day.
I’ve always believed that what separates an average PR professional from an exceptional one is their ability to create something meaningful when there’s nothing obvious to say. No product launch, no funding announcement, no M&A. Rather, the communications expert needs to dig into their own curiosity, industry knowledge, and creativity.
Sometimes, existing research and third-party data is enough to support a narrative. But often, it isn’t. Some of the most impactful campaigns I’ve seen didn’t rely on external data; they created it. In doing so, the data didn’t just support the story; it became the story.
That said, creating compelling data isn’t as simple as fielding a survey and hoping something interesting emerges. Based on my experience working with dozens of brands over the years, here are a few considerations that separate forgettable reports from ones that actually drive conversation.
The goal isn’t to produce data–it’s to spark and own a conversation. If your company operates in hiring and training, for example, do you want to be known for identifying emerging skills? Forecasting how AI will reshape roles? Or challenging conventional thinking about how companies evaluate talent?
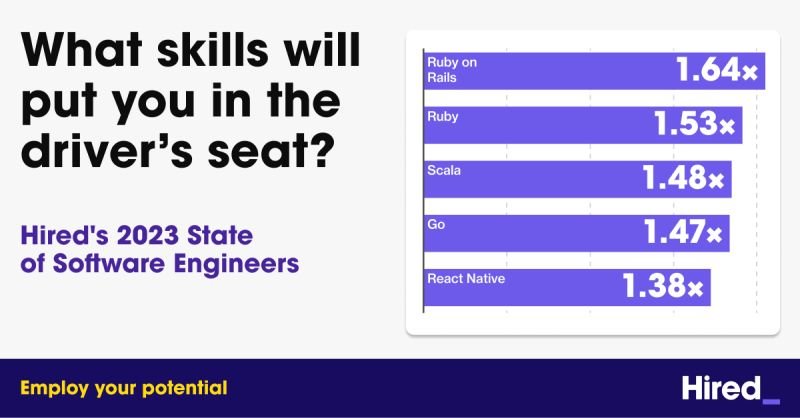
In my work with Hired for several years, we worked on producing quarterly reports about hiring trends in tech, with topics ranging from the state of salaries to the most in-demand skills by employers. As an AI hiring marketplace, Hired had a lot of real-time, proprietary information at its fingertips from both employers and candidates, but we also designed an extensive questionnaire to add deeper insights to support the quantitative findings. Each report was treated as a strategic asset, lead magnet, and conversation starter. As such, rather than recycling the same questions each year, we spent time scrutinizing what was being asked, how the market had evolved, and what key issues would be most valuable to understand before moving forward with each report.
Too often, companies start with questions and hope a narrative emerges. The best data-driven campaigns do the opposite: they start with a clear point of view, then design research that sharpens and supports it.
Different angles will appeal to different audiences. But the beauty of data is that the same data can tell a story in more than one way.
For example, in my work with Hired, we had data about the top tech salaries across the country, which produced multiple stories. One year, we had an economic angle focused on salaries dropping to five-year record lows, alongside a more tech-focused angle about which types of specialized engineers are seeing the highest demand for roles.
The dataset didn’t change, but the framing of our stories did, depending on how we sliced the findings. The strength of a data-driven PR program isn’t just in segmenting data, but in interpreting it through the lens of the target audience. Reporters would often proactively reach out, asking when the next report would be forthcoming. Prospects and customers would eagerly download the report. Ultimately, this resulted in hundreds of media articles, marketing-qualified leads and conversions to Hired.
Before investing in data creation, it’s critical to understand what’s already out there. Creating a survey or research report isn’t a revolutionary approach, but because it can be effective when done well, too many companies jump on the bandwagon, only to fail because the data is too self-serving or says nothing interesting at all.
Ahead of putting any questions or hypotheses into the field, it’s essential to read up on what insights are already available. For a topic as saturated as AI, the risk of not saying anything newsworthy or compelling is high, when there are reports that are released by a company virtually every day.
In the early months of the COVID pandemic, remote work was a huge topic, as companies looked at evolving its workplace policies, and employees sought more work flexibility. Unsurprisingly, there were hundreds of articles on the topic each day. My work with Remote, an HR platform that helps companies hire employees and contractors from all over the world, included devising and launching the inaugural list of the Best Destinations for Remote Work–a list of the top cities based on key criteria that we devised. This list continues to be updated each year.
Companies that release recurring reports based on proprietary data, such as the ADP National Employment Report that is timed each month to coincide with the US jobs report, succeed not because they publish data, but because they publish something others can’t easily replicate. It’s timely and extensive, and is always anticipated as an indicator of the economy.
Too many surveys exist to validate what everyone already suspects: employees are stressed, AI adoption is rising, budgets are tightening. That’s not insight–and it’s definitely not news.
The real opportunity is to capture change and get ahead of the news curve. Ask questions such as: What’s shifting that hasn’t fully played out yet? What contradictions are emerging? What are people doing that conflicts with what they say they believe?
In my work with EDITED, a retail intelligence company, our data program tapped into the real-time analytics in its platform, which gave us an edge in our storylines. How was a brand performing based on its controversial statements? How were retailers preparing to compete against Amazon for its annual Prime Day sales? What predictions could we make ahead of Black Friday and Cyber Monday?
Anticipating what stories would generate interest and having compelling data and spokesperson meant that within a year, we secured hundreds of articles in top-tier outlets including The New York Times, Bloomberg, Fortune, Fast Company, NPR, Forbes, and many others–and these publications featured at multiple times over the course of the year. Public relations became the top driver of traffic to the website within the first year, accelerating awareness of the UK brand in the saturated US market.

Charts and visuals aren’t just about making information easier to digest, they’re about making it easier to share. A strong data point packaged into a clear, standalone visual can travel well beyond the original report. Think about how to create bite-sized pieces of information that can be incorporated into articles, presentations, a series of social media posts, and beyond.
In a crowded media and information landscape, when companies are all vying for attention, visuals and video assets can cut through the clutter. What kind of graphs, charts, analogies, and other representations can best convey the data, to make someone pause and take notice?
At Gravitate PR, I’ve worked with brands like Hired, EDITED, and Remote and many others to build data-driven campaigns that generate meaningful coverage and conversation. If you’re thinking about how to create data-driven campaigns that set your brand apart, let’s chat.